Monitoring the CPU utilization of a SQL Server instance is crucial for maintaining optimal performance and identifying any potential bottlenecks. In this blog post, we will explore how to analyze CPU utilization using T-SQL and create a stored procedure for easy execution.
T-SQL Query
Let’s start by examining a T-SQL query that retrieves the CPU utilization information from the SQL Server system tables:
-- Declare and assign value to @ts_now variable
DECLARE @ts_now BIGINT = (SELECT cpu_ticks / (cpu_ticks / ms_ticks) FROM sys.dm_os_sys_info);

-- Retrieve the top 100 records with the required columns
SELECT TOP 100
    record.value('(Record/@id)[1]', 'INT') AS RecordID, -- Retrieve the record ID
    DATEADD(MILLISECOND, -1 * (@ts_now - [timestamp]), GETDATE()) AS EventTime, -- Calculate the event time
    CONCAT(record.value('(Record/SchedulerMonitorEvent/SystemHealth/SystemIdle)[1]', 'INT'), '%') AS SystemIdleProcess, -- Calculate the system idle process utilization with percentage symbol
    CONCAT(CASE WHEN record.value('(Record/SchedulerMonitorEvent/SystemHealth/SystemIdle)[1]', 'INT') IS NULL THEN 100 ELSE 100 - record.value('(Record/SchedulerMonitorEvent/SystemHealth/SystemIdle)[1]', 'INT') END, '%') AS SystemCPUUtilization, -- Calculate the system CPU utilization with percentage symbol
    CONCAT(record.value('(Record/SchedulerMonitorEvent/SystemHealth/ProcessUtilization)[1]', 'INT'), '%') AS SQLCPUUtilization -- Calculate the SQL CPU utilization with percentage symbol
FROM (
    -- Retrieve XML records from sys.dm_os_ring_buffers table
    SELECT timestamp, CONVERT(XML, record) AS record
    FROM sys.dm_os_ring_buffers
    WHERE ring_buffer_type = 'RING_BUFFER_SCHEDULER_MONITOR'
        AND record LIKE '%<SystemHealth>%'
) AS t
ORDER BY RecordID DESC;The T-SQL query consists of several steps:
- We start by declaring and assigning a value to the
@ts_nowvariable. This variable calculates the current timestamp for event time calculations. - Next, we retrieve the top 100 records from the system tables. The query extracts relevant information such as the record ID, event time, system idle process utilization, system CPU utilization, and SQL CPU utilization.
- To calculate the system idle process utilization, we extract the
SystemIdlevalue from thesys.dm_os_ring_bufferstable and append the percentage symbol (“%”) to the result. - For the system CPU utilization, we subtract the system idle process utilization from 100 to get the active CPU utilization. Again, we append the percentage symbol to the result.
- Finally, we retrieve the SQL CPU utilization from the XML records, converting it to a percentage by appending the percentage symbol.
Creating a Stored Procedure
To simplify the execution of the CPU utilization analysis, let’s create a stored procedure encapsulating the T-SQL query:
CREATE PROCEDURE GetCPUUtilization
AS
BEGIN
    -- Declare and assign value to @ts_now variable
DECLARE @ts_now BIGINT = (SELECT cpu_ticks / (cpu_ticks / ms_ticks) FROM sys.dm_os_sys_info);

-- Retrieve the top 100 records with the required columns
SELECT TOP 100
    record.value('(Record/@id)[1]', 'INT') AS RecordID, -- Retrieve the record ID
    DATEADD(MILLISECOND, -1 * (@ts_now - [timestamp]), GETDATE()) AS EventTime, -- Calculate the event time
    CONCAT(record.value('(Record/SchedulerMonitorEvent/SystemHealth/SystemIdle)[1]', 'INT'), '%') AS SystemIdleProcess, -- Calculate the system idle process utilization with percentage symbol
    CONCAT(CASE WHEN record.value('(Record/SchedulerMonitorEvent/SystemHealth/SystemIdle)[1]', 'INT') IS NULL THEN 100 ELSE 100 - record.value('(Record/SchedulerMonitorEvent/SystemHealth/SystemIdle)[1]', 'INT') END, '%') AS SystemCPUUtilization, -- Calculate the system CPU utilization with percentage symbol
    CONCAT(record.value('(Record/SchedulerMonitorEvent/SystemHealth/ProcessUtilization)[1]', 'INT'), '%') AS SQLCPUUtilization -- Calculate the SQL CPU utilization with percentage symbol
FROM (
    -- Retrieve XML records from sys.dm_os_ring_buffers table
    SELECT timestamp, CONVERT(XML, record) AS record
    FROM sys.dm_os_ring_buffers
    WHERE ring_buffer_type = 'RING_BUFFER_SCHEDULER_MONITOR'
        AND record LIKE '%<SystemHealth>%'
) AS t
ORDER BY RecordID DESC;
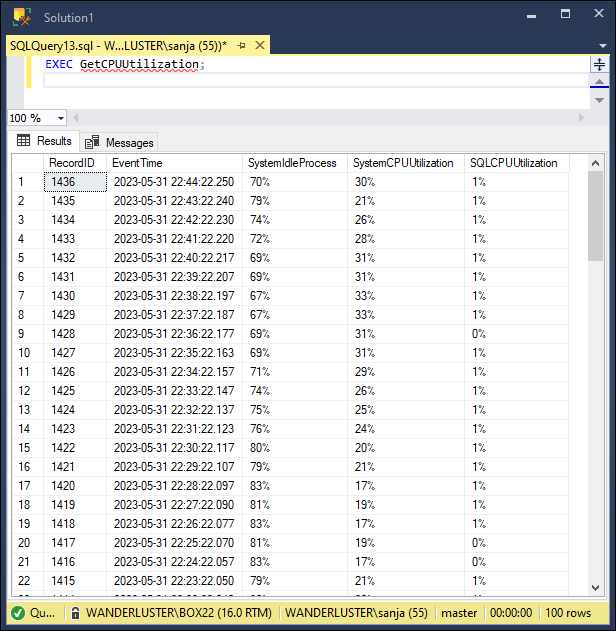
ENDWith the stored procedure created, we can now execute it using the following command:
EXEC GetCPUUtilization;This will return the same result as running the T-SQL query directly. The stored procedure provides a convenient way to analyze CPU utilization with a single command, making it easier to integrate into scripts or automate the monitoring process.